import numpy as np
import pandas as pd
import matplotlib
from matplotlib import pyplot as plt

import os

from sklearn import preprocessing

import torch
import torch.nn as nn
from torch.utils.data.dataset import Dataset
from torch.utils.data import DataLoader

import rasterio as rio
import earthpy as et
import earthpy.spatial as es
import earthpy.plot as ep5 DataSets and DataLoaders
5.1 Introduction
We have one last topic to cover before we can train a fully connected neural network. You can now define a network architecture; specify loss functions, assessment metrics, and optimizers; and build a simple training loop. Key missing pieces are loading in data, converting them into tensors, and defining mini-batches. Here, I will demonstrate using the DataSet and DataLoader classes made available in torch.utils. For working with imagery data specifically, torchvision provides custom dataset classes that are subclasses of DataSet including DatasetFolder, ImageFolder, and VisionDataset. There are also datasets built into torchvision. Please see this page for more details: https://pytorch.org/vision/stable/datasets.html.
As already discussed, tensors are a flexible data model that can represent a wide variety of data types. For example, tabulated data can be represented as a 2D array in which each row represents a sample and each column stores different information about each record. An image can be stored as a 3D array (Channels, Height, and Width) while a video can be stored as a 4D array (Time/Frame, Channels, Height, and Width).
Raw data can exist in many forms and be stored in a variety of file formats. For example, an image can be stored as a TIFF, JPEG, or PNG file. Images can also vary based on their radiometric gain (i.e., 8-bit, 11-bit, or 16-bit) and the number of channels. Given these complexities, we need a flexible means by which to be able to read files and convert them to tensors of the appropriate data types and shapes for input to the deep learning process. This is the purpose of the DataSet and DataLoader classes in PyTorch.
As normal, I begin by importing the required packages. Since I will be working with arrays and data tables, I import NumPy and Pandas. I will use the pyplot subpackage of the matplotlib package to visualize image data. I will need to work with file paths and file names, so I import os. As in the Losses and Assessment Metrics module, I will use scikit-learn to recode differentiated classes from strings to numeric codes. The torch package and torch.nn subpackage are imported. The DataSet class is available in the utils.data.dataset subpackage while the DataLoader class is available in torch.utils.data.
We will be working with satellite data in this module, so I import the Rasterio package with an alias of rio. I have found that this package can sometimes be tricky to install into an environment with a lot of other packages. Please consult the package documentation if you are having issues. Lastly, I will use earthpy to visualize the satellite data.
Since I will be working with images, it is a good idea to use the GPU as opposed to CPU. Since I will not be training a model in this module, only preparing the data, DataSet, and DataLoader, this is not strictly necessary. However, it will be preferable in the next module when I train and evaluate a model.
device = torch.device("cuda:0" if torch.cuda.is_available() else "cpu")
print(device)cuda:05.2 EuroSatAllBands Dataset
In this class, we will make use of the EuroSat dataset, which can be downloaded from Zenodo: https://zenodo.org/records/7711810. There are two versions of these data: an RGB version (EuroSAT_RGB.zip) and a multispectral version with all 13 bands (EuroSAT_MS.zip), which we refer to as EuroSatAllBands. We will make use of the data with all 13 bands. The band designations and associated spatial resolutions are as follows:
- 1 = Coastal Aerosol (60 m)
- 2 = Blue (10 m)
- 3 = Green (10 m)
- 4 = Red (10 m)
- 5 = Red Edge 1 (20 m)
- 6 = Red Edge 2 (20 m)
- 7 = Red Edge 3 (20 m)
- 8 = Near Infrared (NIR) (10 m)
- 8a = NIR Narrow (10 m)
- 9 = Water Vapor (60 m)
- 10 = Cirrus Cloud (60 m)
- 11 = Shortwave Infrared (SWIR) 1 (20 m)
- 12 = SWIR 2 (20 m)
These data were derived from the Multispectral Instrument (MSI) onboard the Sentinel-2A and 2B satellites, which are operated by the European Space Agency (ESA) as part of the Copernicus Program. The bands vary by spatial resolution from 10 m to 60 m; however, all bands have been resampled to a 10 m spatial resolution in the EuroSat and EuroSatAllBands datasets. We will only use the bands that were originally collected at 10 m or 20 m in this course: red, green, blue, red edge 1, red edge 2, red edge 3, NIR, narrow NIR, SWIR 1, and SWIR 2. This paper introduces these data:
Helber, P., Bischke, B., Dengel, A. and Borth, D., 2019. “Eurosat: A novel dataset and deep learning benchmark for land use and land cover classification.” IEEE Journal of Selected Topics in Applied Earth Observations and Remote Sensing, 12(7), pp.2217-2226.
To follow along with this example, you will need to download EuroSAT_MS.zip from Zenodo and uncompress it. Note that this is a fairly large dataset, so it will take some time to download and uncompress.
5.3 Data Preparation
In this first section, we will focus on some data preparation steps. You will need to set the path to your copy of the uncompressed data. I first list all of the subfolders inside of the EuroSatallBands folder. Each subfolder stores images representing different classes: annual crop, forest, herbaceous vegetation, highways, industrial, pasture, permanent crop, residential, river, and sea/lake. There is a total of 10 classes differentiated. In the first code block, I am using the os package and list comprehension to list all of the folders. I then subset out only the base name from the entire folder path.
In the next code block, I create an empty DataFrame then loop through all of the subfolders to list all of the files that they contain. I create list objects that store the file name, the full file path, and the class name, which is the same as the subfolder in which it occurs. I then combine these into a DataFrame and merge them into the initially empty imgDF DataFrame.
PyTorch requires that each category be represented with a numeric code as opposed to a string. So, as you already saw in the Losses and Assessment Metrics module, I use the LabelEncoder() function from the preprocessing subpackage of scikit-learn to generate numeric codes for each class, which are defined alphabetically. I then write this to a new column in the imgDF DataFrame. As a result, I now have a DataFrame in which each row represents a sample image and discrete columns provide the file name, full file path, class name, and class numeric code.
Lastly, I print the imgDF object to make sure it looks correct. There are a total of 27,000 samples in the dataset.
ImportantData Location
This chapter uses the multispectral version of the EuroSAT dataset (EuroSATallBands), which is too large to include in the book download and must be downloaded from the source listed in Table 2 (EuroSAT_MS.zip). By default, the code expects the uncompressed EuroSAT_MS folder, which contains one subfolder of images per class, to be saved in the data/files folder (data/files/EuroSAT_MS). If you saved the data elsewhere, set folder below to the folder’s location on your machine.
# Set this to the location of the uncompressed EuroSAT_MS folder on your machine.
folder = "data/files/EuroSAT_MS/"
clsLst = [ f.path for f in os.scandir(folder) if f.is_dir() ]
clsLst = [os.path.basename(f) for f in clsLst]
clsLst
['AnnualCrop', 'Forest', 'HerbaceousVegetation', 'Highway', 'Industrial', 'Pasture', 'PermanentCrop', 'Residential', 'River', 'SeaLake']imgDF = pd.DataFrame(columns = ["file", "fullpath", "class"])
for f in clsLst:
currentFolder = folder + f + "/"
currentClass = f
imgLst = os.listdir(currentFolder)
pathLst = [currentFolder+img for img in imgLst]
imgDFCurrent = pd.DataFrame({"file": imgLst, "fullpath":pathLst})
imgDFCurrent["class"] = f
imgDF = pd.concat([imgDF, imgDFCurrent], axis=0, ignore_index = True)
label_encoder = preprocessing.LabelEncoder()
imgDF['code'] = label_encoder.fit_transform(imgDF['class'])imgDF.head() file ... code
0 AnnualCrop_1.tif ... 0
1 AnnualCrop_10.tif ... 0
2 AnnualCrop_100.tif ... 0
3 AnnualCrop_1000.tif ... 0
4 AnnualCrop_1001.tif ... 0
[5 rows x 4 columns]The EuroSatAllBands dataset comes with CSV files that list out the images into separate training, testing, and validation sets. However, we will step through the process of defining these data partitions on our own since you may need to do this with your own datasets.
I first shuffle the rows of the DataFrame using the sample() Pandas method. Setting the frac parameter to 1 means that all rows will be maintained, so I am not drawing a sample from the dataset but simply shuffling it. This is done to avoid any autocorrelation in the data.
I then print the number of rows or samples per class using Pandas. It doesn’t appear as if there is any issues with data imbalance, so I will not worry about this specific issue in my analyses. In other words, there are an ample number of samples in each class.
imgDF = imgDF.sample(frac = 1)print(imgDF.groupby('class').size())class
AnnualCrop 3000
Forest 3000
HerbaceousVegetation 3000
Highway 2500
Industrial 2500
Pasture 2000
PermanentCrop 2500
Residential 3000
River 2500
SeaLake 3000
dtype: int64Next, I split the data using a stratified random sampling method. This involves first splitting out a training set then further splitting the remaining samples into separate testing and validation sets. Although stratified random sampling is not really necessary here, I wanted to demonstrate this since it is common to want to apply stratification to your sampling. Here, I have used 60% of the data for training, 20% for testing, and 20% for validation. Remember that the training data are used to train the model and guide the parameter updates while the validation data are used to assess the model at the end of each training epoch. The test data are reserved to assess the final model. Printing the lengths of each DataFrame, you can see that there are 16,200 training, 5,400 validation, and 5,400 testing samples.
Since I want to save these data partitions and tables for later use, such as in the next module when I actually train a neural network, I write them to disk as CSV files using the to_csv() method from Pandas. I then read the results back into the workflow.
Since the partitions are generated randomly, running this code again will produce a different split. The trained models provided with this text were developed using the partitions saved in the data/files/tables folder (mytrain.csv, mytest.csv, and myval.csv). The code below writes your new partitions to the data/output folder so that the provided copies are not overwritten. So, from this point forward, we read in these saved partitions as opposed to the new split. This ensures that the provided models are assessed using samples that were not used to train them. Since the saved tables store the image file paths from the computer on which they were created, we update the “fullpath” column using the folder variable. Similarly, the band means calculated below are written to the data/output folder, and the provided copies are read from the data/files/EuroSat_Tabulated folder.
train = imgDF.groupby('class').sample(frac=0.60, random_state=42)
leftovers=imgDF.drop(train.index)
test=leftovers.groupby('class').sample(frac=0.5, random_state=42)
val=leftovers.drop(test.index)train.to_csv("data/output/mytrain.csv", index=False)
test.to_csv("data/output/mytest.csv", index=False)
val.to_csv("data/output/myval.csv", index=False)train = pd.read_csv("data/files/tables/mytrain.csv")
test = pd.read_csv("data/files/tables/mytest.csv")
val = pd.read_csv("data/files/tables/myval.csv")
# The saved partitions (data/files/tables) store paths from the original machine, so point each
# image to its location in the EuroSATallBands folder.
for df in [train, test, val]:
df["fullpath"] = folder + df["class"] + "/" + df["file"]train.head() file ... code
0 AnnualCrop_11.tif ... 0
1 AnnualCrop_1669.tif ... 0
2 AnnualCrop_2478.tif ... 0
3 AnnualCrop_2137.tif ... 0
4 AnnualCrop_2176.tif ... 0
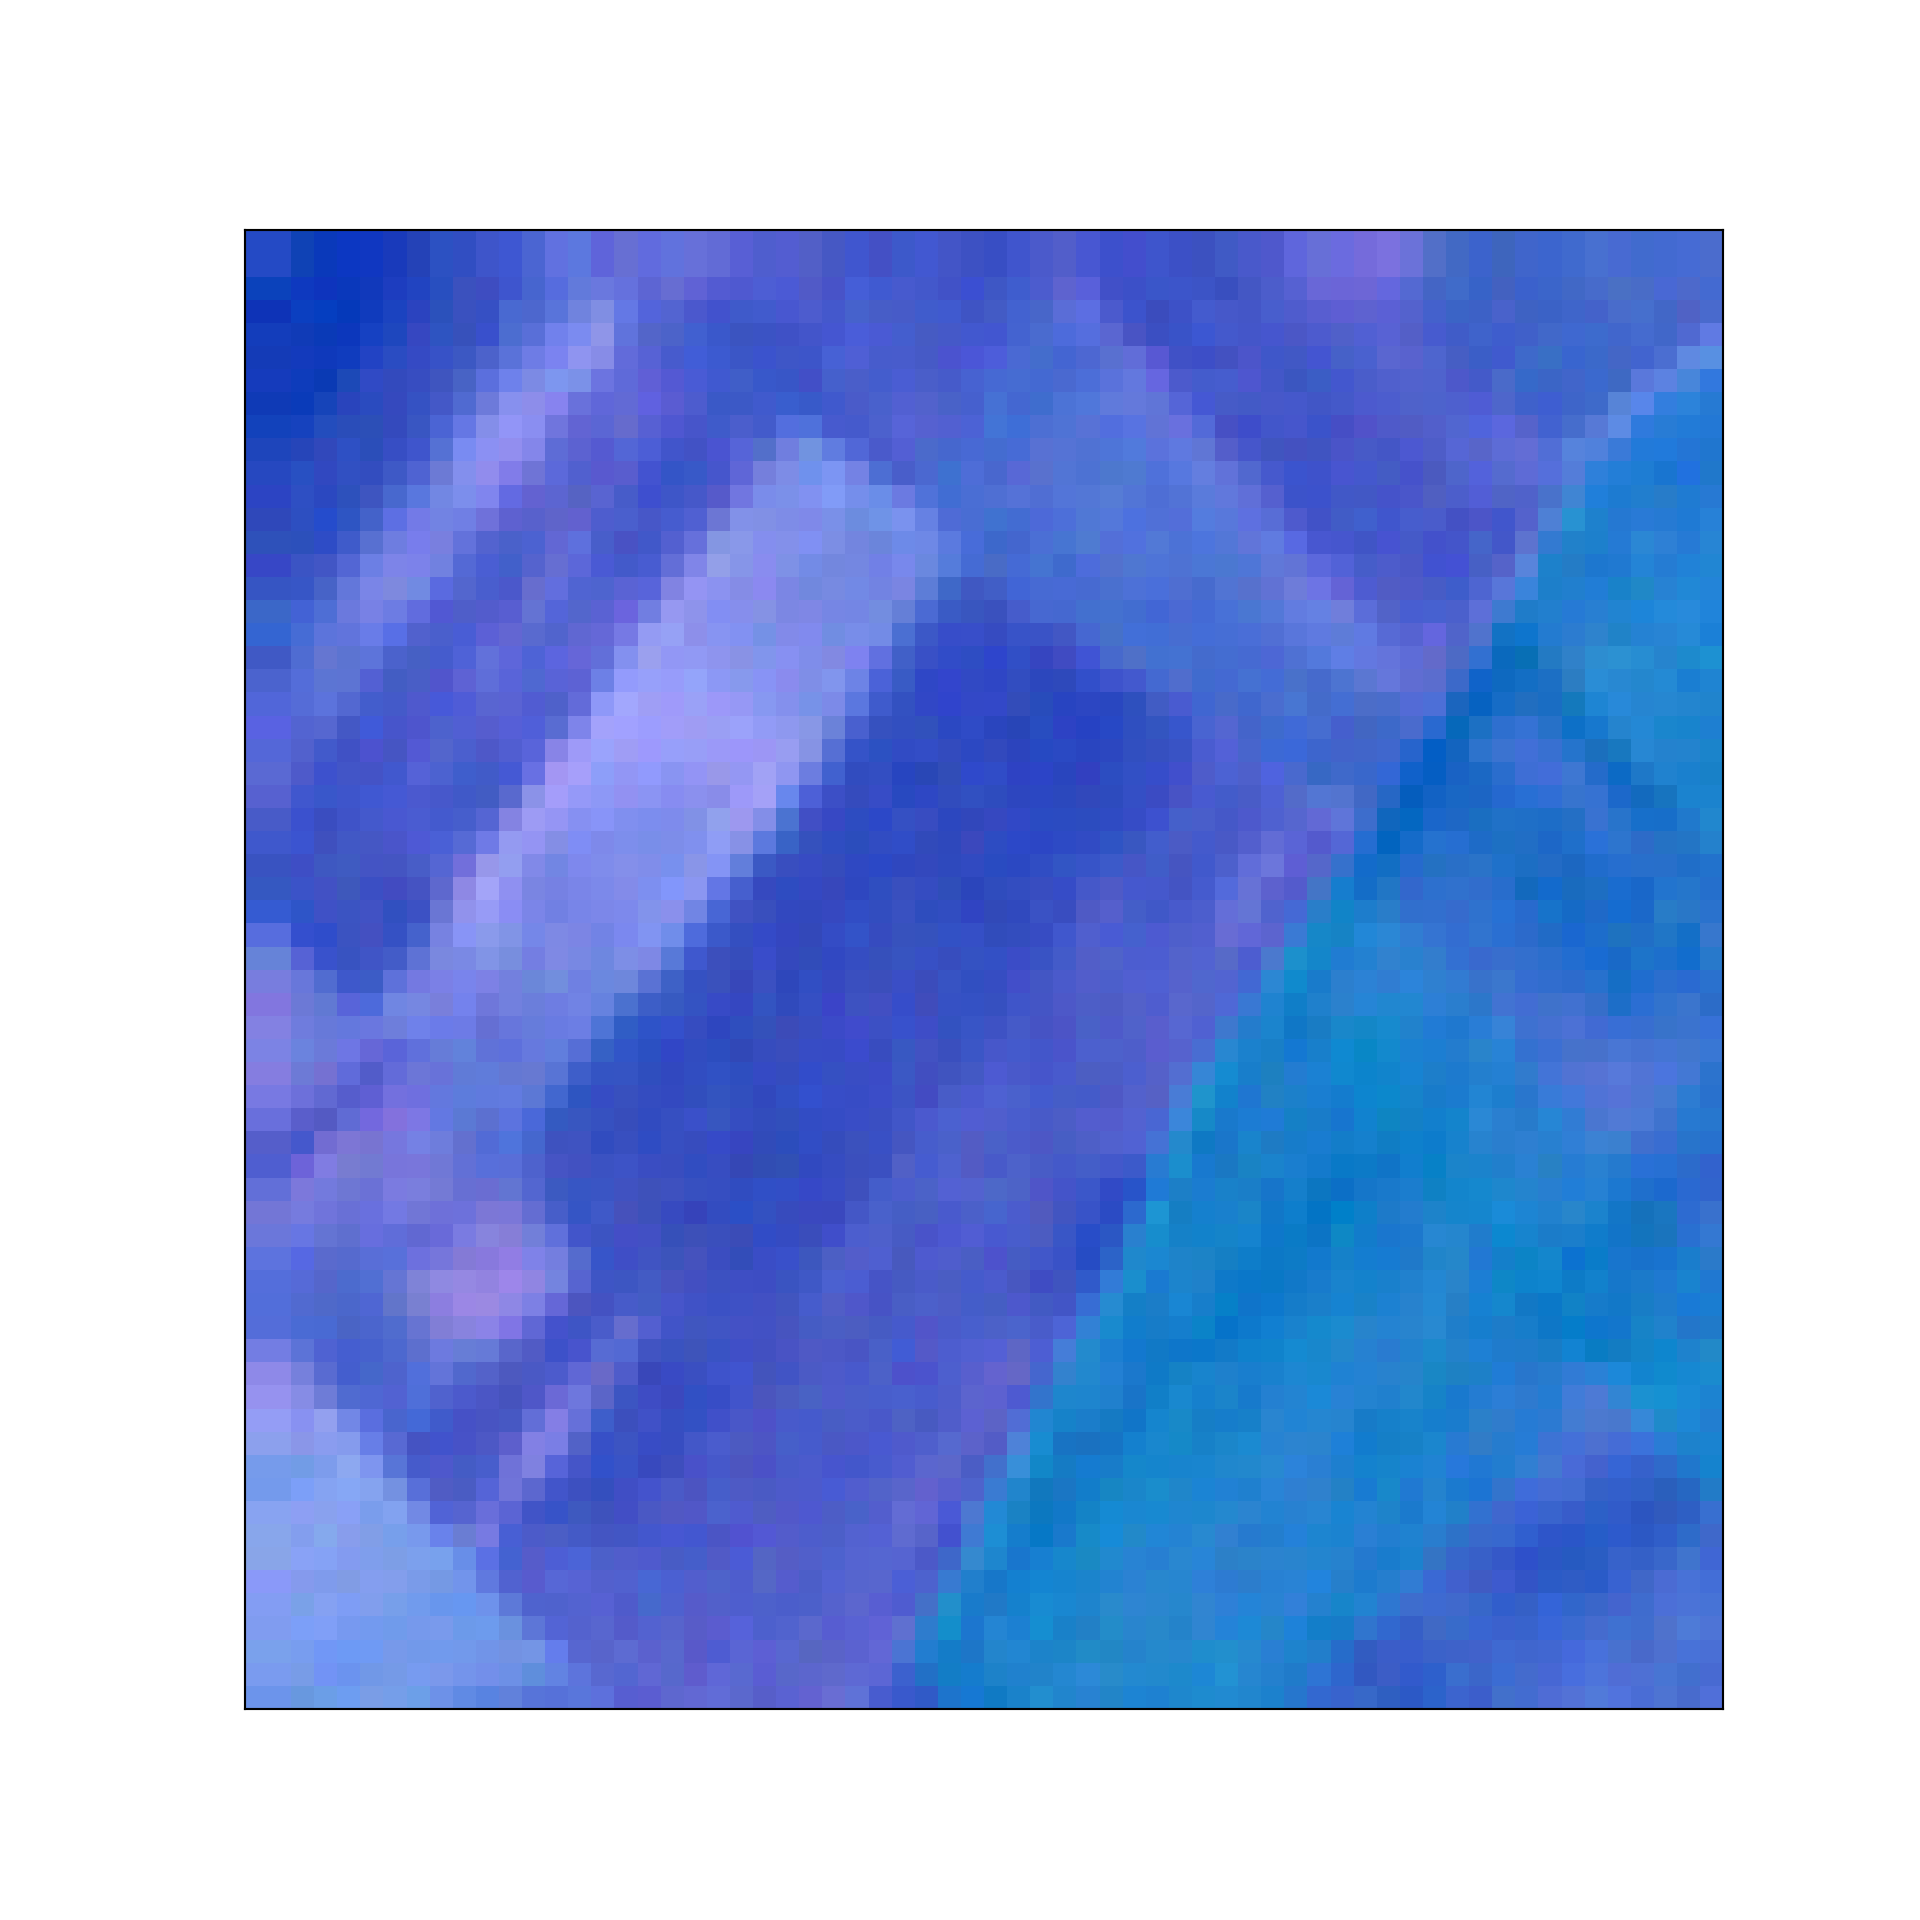
[5 rows x 4 columns]Before moving on, let’s plot one of the images as a check. To plot the image, I extract one of the image paths from the train object. I then use the Rasterio package to read the image. When using Rasterio, you need to open a connection to the image, read the image data in as a NumPy array using read(), and then close the connection to the image. If you open a connection to an image with Rasterio, you should also remember to close it. The read() function also allows you to only read in a subset of the available bands if desired.
I next print the array shape and calculate the channel means using np.mean and aggregating across the height and width dimensions. Note that Rasterio, similar to PyTorch, uses the channels-first convention, as opposed to the channels-last convention. The array has a shape of (13,64,64). So, there are 13 channels, and each image chip has a height and width of 64 pixels. Since the pixel size is 10 m, this would be equivalent to spatial dimensions of 640 m by 640 m.
Lastly, I use the plot_rgb() function from earthpy to plot a simulated true color composite of the image. The red channel shows red, the green channel shows green, and the blue channel shows blue.
img1 = train.iloc[0,1]
source = rio.open(img1)
img1Arr = source.read()
source.close()print(img1Arr.shape)(13, 64, 64)print(np.mean(img1Arr, axis=(1,2)))[1803.3371582 1364.09106445 1017.75024414 880.46142578 1068.66796875
1518.2878418 1671.83007812 1572.86254883 537.56445312 13.32641602
1153.97387695 723.68945312 1742.8918457 ]ep.plot_rgb(
img1Arr,
rgb=(3,2,1), # place the combination of rgb
)
print(train.iloc[0,2])AnnualCrop5.4 Aggregate to Band Means
When we start working with convolutional neural networks (CNNs) we will use the actual images as input to the model. However, for our fully connected neural network examples, we will use the band means. It is possible to use all of the pixels, which requires flattening the data. However, this would result in a large input space (13 bands by 64 rows by 64 columns). This would be one way to work with these data using a fully connected architecture. However, to reduce the size of the data, I will aggregate to obtain band means. This mimics a traditional, pixel-based image classification that does not incorporate spatial patterns or image context information. Again, we will use spatial context information and the full set of pixels when we investigate convolutional neural networks.
In the first code block, I aggregate the pixel data for each image chip to obtain band means. This requires (1) defining an empty DataFrame to write to, (2) reading a file path, (3) reading the data in as a NumPy array using Rasterio, (4) subsetting out the 10 bands that I want to include in the analysis, (5) calculating the band means by aggregating all of the pixels by channel, and (6) writing the results to the DataFrame. This process is completed for the training, validation, and testing data separately to obtain three separate DataFrames. Note that this code may take some time to execute given the large number of images that must be processed.
Printing the trainAgg result as an example, you can see that I now have a table in which each row represents an image and the following information is stored: class, class numeric code, and band means for the 10 bands of interest. Next, I use the describe() method to further explore the results and obtain summary statistics for each band.
trainAgg = pd.DataFrame(columns=["class", "code", "blue", "green",
"red", "red_edge1", "red_edge2",
"red_edge3", "NIR", "NIR_Narrow", "swir1", "swir2"])
for i in range(0, len(train)):
    img1 = train.iloc[i,1]
    source = rio.open(img1)
    img1Arr = source.read()
    source.close()
    img1Arr = img1Arr[[1,2,3,4,5,6,7,8,11,12], :, :]
    img1Mns = np.mean(img1Arr, axis=(1,2))
    trainAgg2 = pd.DataFrame({"class": [train.iloc[i,2]],
    "code": [train.iloc[i,3]],
    "blue":[img1Mns[0]],
    "green":[img1Mns[1]],
    "red":[img1Mns[2]],
    "red_edge1":[img1Mns[3]],
    "red_edge2":[img1Mns[4]],
    "red_edge3":[img1Mns[5]],
    "NIR":[img1Mns[6]],
    "NIR_Narrow":[img1Mns[7]],
    "swir1":[img1Mns[8]],
    "swir2":[img1Mns[9]]})
    trainAgg = pd.concat([trainAgg, trainAgg2], axis=0, ignore_index=True)

testAgg = pd.DataFrame(columns=["class", "code", "blue", "green",
"red", "red_edge1", "red_edge2",
"red_edge3", "NIR", "NIR_Narrow", "swir1", "swir2"])
for i in range(0, len(test)):
    img1 = test.iloc[i,1]
    source = rio.open(img1)
    img1Arr = source.read()
    source.close()
    img1Arr = img1Arr[[1,2,3,4,5,6,7,8,11,12], :, :]
    img1Mns = np.mean(img1Arr, axis=(1,2))
    testAgg2 = pd.DataFrame({"class": [test.iloc[i,2]],
    "code": [test.iloc[i,3]],
    "blue":[img1Mns[0]],
    "green":[img1Mns[1]],
    "red":[img1Mns[2]],
    "red_edge1":[img1Mns[3]],
    "red_edge2":[img1Mns[4]],
    "red_edge3":[img1Mns[5]],
    "NIR":[img1Mns[6]],
    "NIR_Narrow":[img1Mns[7]],
    "swir1":[img1Mns[8]],
    "swir2":[img1Mns[9]]})
    testAgg = pd.concat([testAgg, testAgg2], axis=0, ignore_index=True)

valAgg = pd.DataFrame(columns=["class", "code", "blue", "green",
"red", "red_edge1", "red_edge2",
"red_edge3", "NIR", "NIR_Narrow", "swir1", "swir2"])
for i in range(0, len(val)):
    img1 = val.iloc[i,1]
    source = rio.open(img1)
    img1Arr = source.read()
    source.close()
    img1Arr = img1Arr[[1,2,3,4,5,6,7,8,11,12], :, :]
    img1Mns = np.mean(img1Arr, axis=(1,2))
    valAgg2 = pd.DataFrame({"class": [val.iloc[i,2]],
    "code": [val.iloc[i,3]],
    "blue":[img1Mns[0]],
    "green":[img1Mns[1]],
    "red":[img1Mns[2]],
    "red_edge1":[img1Mns[3]],
    "red_edge2":[img1Mns[4]],
    "red_edge3":[img1Mns[5]],
    "NIR":[img1Mns[6]],
    "NIR_Narrow":[img1Mns[7]],
    "swir1":[img1Mns[8]],
    "swir2":[img1Mns[9]]})
    valAgg = pd.concat([valAgg, valAgg2], axis=0, ignore_index=True)
trainAgg.head() class code blue ... NIR_Narrow swir1 swir2
0 AnnualCrop 0 1364.091064 ... 537.564453 723.689453 1742.891846
1 AnnualCrop 0 1015.084229 ... 1084.26709 1028.562988 3928.543213
2 AnnualCrop 0 1422.566406 ... 910.25 1687.009766 4625.437012
3 AnnualCrop 0 1200.931885 ... 535.550049 1591.909912 3193.824219
4 AnnualCrop 0 1309.351807 ... 678.571533 1351.122803 3343.161865
[5 rows x 12 columns]trainAgg.describe() class code ... swir1 swir2
count 16200 16200 ... 16200.000000 16200.000000
unique 10 10 ... 16171.000000 16195.000000
top AnnualCrop 0 ... 1213.699463 2644.484863
freq 1800 1800 ... 2.000000 2.000000
[4 rows x 12 columns]Since we will use these aggregated data in the next module, I save them to disk as CSV files then read them back into the workflow as Pandas DataFrames. I will also want to be able to normalize these data before providing them to the fully connected neural network. This can be accomplished using the following equation to obtain a z-score:
(current value - mean)/standard deviation
In order to accomplish this, I need to have the band means and standard deviations calculated. This is accomplished in the last code block were the columns associated with the band means are extracted, the mean or standard deviation is calculated for each band, and the results are flattened to a 1D NumPy array.
trainAgg.to_csv("data/output/train_aggregated.csv")
testAgg.to_csv("data/output/test_aggregated.csv")
valAgg.to_csv("data/output/val_aggregated.csv")
trainAgg = pd.read_csv("data/files/EuroSat_Tabulated/train_aggregated.csv")
testAgg = pd.read_csv("data/files/EuroSat_Tabulated/test_aggregated.csv")
valAgg = pd.read_csv("data/files/EuroSat_Tabulated/val_aggregated.csv")trainAggMns = np.array(trainAgg.iloc[:,3:].mean(axis=0)).flatten()
print(trainAggMns)[1116.07645724 1035.31213955 937.87729602 1184.29159721 1971.09456594
2334.38145703 2262.04021603 724.95266414 1103.83350066 2552.01787743]trainAggSDs = np.array(trainAgg.iloc[:,3:].std(axis=0)).flatten()
print(trainAggSDs)[ 255.54328897 312.29876238 479.85770488 500.93361557 779.66575883
976.84613356 970.08515215 384.49257895 670.88688372 1120.89990655]5.5 Pixel-Level Statistics
In this section, we will explore calculating band means and standard deviations at the pixel-level per band as opposed to using the aggregated data, as demonstrated above. Pixel-level band means and standard deviations are necessary or useful for normalizing data. Although we will not use this information when working with fully connected neural networks, we will use it later once we start exploring convolutional neural networks. Since the data volume is now much larger, as a result of working with pixels as opposed to the aggregated data, this can be accomplished using batches. So, this will be the first time that we need to define a DataSet and DataLoader.
A custom DataSet is created by subclassing the DataSet class. The goal of a DataSet is to generate a pipeline that delivers to the DataLoader and training loop tensors of the correct shape and data type for each sample. The __getitem__() method defines how a single sample is read then converted into a tensor. The other required method is __len__(), which returns the number of available samples. Let’s now step through this first DataSet subclass.
Within the __init__() constructor method, I inherit from the parent or super class using super().__init__. I then define new parameters. In this case, the DataSet will only accept a DataFrame object.
Within the __getitem__() method, I (1) get the file path from the associated DataFrame column, (2) get the class numeric code from the associated DataFrame column and convert it to a NumPy array, (3) read the image in as a NumPy array using Rasterio (making sure to close the connection after reading the data), (4) convert the image data type to 32-bit float, (5) subset out the 10 bands of interest, (6) convert the label and image NumPy arrays to torch tensors using the from_numpy() function (I must also squeeze and flatten the data so that they are the correct shape), (7) convert the label tensor to a long integer data type, and (8) return the image and label tensors. Note that the idx variable references the current row or image being processed. It is important that the __getitem__() method return torch tensors for both the predictor variables, in this case the multiband image, and the labels with the shapes and data types required by the neural network architecture.
Inside of the __getitem__() method, it is common to perform data transformations on arrays representing image data, such as cropping, resampling, and normalization. Additional transformations can be randomly applied to augment the data and to potentially combat overfitting. The torchvision package provides functions for applying data transformations. We will not explore those here, but will do so when we define DataSets for training CNNs in later modules. For semantic segmentation, we will specifically use the Albumentations package.
The __len__() method simply returns the number of available samples, which in this case is the length or number of rows in the input DataFrame.
class EuroSat(Dataset):

    def __init__(self, df):
        super().__init__
        self.df = df

    def __getitem__(self, idx):
        image_name = self.df.iloc[idx, 1]
        label = self.df.iloc[idx, 3]
        label = np.array(label)
        source = rio.open(image_name)
        image = source.read()
        source.close()
        image = image.astype('float32')
        image = image[[1,2,3,4,5,6,7,8,11,12], :, :]
        image = torch.from_numpy(image)
        label = torch.from_numpy(label)
        label = label.long()
        return image, label

    def __len__(self):
        return len(self.df)
Once a DataSet subclass is defined, an instance can be instantiated. Here, I am creating an instance of the DataSet called trainDS, which represents the training dataset specifically. Calling len() on the dataset returns the number of training samples, in this case 16,558.
trainDS = EuroSat(train)
print(len(trainDS))16200This DataSet is too large to read in all samples at once. Instead, samples will need to be read in using mini-batches. Weight updates will be performed after predicting to each mini-batch, calculating the loss, and performing backpropagation. The number of samples that can be read in at once depends on several factors including the complexity of the neural network architecture, the available resources (e.g., GPU VRAM and number of GPUs), and the size of the images (e.g., you could read in more 64 by 64 pixel chips than 512 by 512 pixel chips). In order to define these data mini-batches, I will need to create a DataLoader.
Below, I am generating a DataLoader from the trainDS dataset. The batch size is 32, the data will be randomly reshuffled at each learning epoch, and the data will not be subsampled at each epoch. The number of workers argument specifies how many subprocesses to use while loading data. At the time of this writing, I have had issues using more than one worker within the Windows operating system. So, I have set this to 0, which is the default. This does seem to work fine on Linux-based machines. The pin_memory option is used to copy tensors into the pinned device or CUDA memory before returning them. The drop_last argument is used to drop the last mini-batch from the computation if it is an incomplete mini-batch or if the total number of samples is not evenly divisible by the mini-batch size.
trainDL = torch.utils.data.DataLoader(trainDS, batch_size=32, shuffle=True, sampler=None,
num_workers=0, pin_memory=False, drop_last=False)
Now that I have a DataSet and a DataLoader defined and instantiated, I define a function that loops over the mini-batches to calculate the mean and standard deviation of the bands at the pixel-level. This function was obtained from the provided link. I then run this function on the DataLoader object. The result is a set of band means and standard deviations as 1D tensors. Again, these values can be useful for normalizing the data.
When you have separate training, testing, and validation sets, it is common to calculate the band means and standard deviations from the training data only but then apply these values to all three DataSets to perform the normalization. This is so that all of the DataSets will have a similar distribution and also to avoid a data leak, in which the model learns something about the testing and/or validation data, which is not desired if we aim to assess overfitting and generalization. Sometimes data will be normalized using means and standard deviations from another dataset. This is especially common when using transfer learning since we want the input data to have a distribution that is similar to that of the data used to train the original model.
#https://www.binarystudy.com/2021/04/how-to-calculate-mean-standard-deviation-images-pytorch.html
def batch_mean_and_sd(loader, inChn):

    cnt = 0
    fst_moment = torch.empty(inChn)
    snd_moment = torch.empty(inChn)

    for images, _ in loader:
        b, c, h, w = images.shape
        nb_pixels = b * h * w
        sum_ = torch.sum(images, dim=[0, 2, 3])
        sum_of_square = torch.sum(images ** 2,
                                  dim=[0, 2, 3])
        fst_moment = (cnt * fst_moment + sum_) / (cnt + nb_pixels)
        snd_moment = (cnt * snd_moment + sum_of_square) / (cnt + nb_pixels)
        cnt += nb_pixels

    mean, std = fst_moment, torch.sqrt(snd_moment - fst_moment ** 2)
    return mean,std
band_stats = batch_mean_and_sd(trainDL, 10)band_stats(tensor([1116.2471, 1040.4570, 945.3619, 1197.1088, 2001.1605, 2372.5615,
2299.6143, 729.5405, 1115.8544, 2598.7522]), tensor([ 334.1141, 395.7998, 595.0168, 567.5589, 859.7593, 1085.7444,
1116.4808, 401.3445, 758.9104, 1230.3986]))5.6 DataSet and DataLoader for Tabulated Data
To further explore defining a DataSet and using a DataLoader, we will now define and prepare them for the fully connected neural network use case in which the predictor variables will be the mean channel values calculated from all the image pixels, and the dependent variable will be the class, as represented with a numeric code. In this new DataSet subclass the resulting tensors for each sample should be the normalized mean channel values for each band while the dependent variable should be the class code.
This new DataSet subclass requires three parameters: an input DataFrame and the band means and standard deviations for normalization. These are defined inside of the __init__() constructor method. Inside of the __getitem__() method, I (1) read in the columns representing the band means and the column representing the class code from the input DataFrame, (2) convert the band means to a NumPy array, (3) normalize the band values using the band means and standard deviations to obtain a z-score, (4) convert the label to a NumPy array, (5) convert the normalized band means to a 32-bit float data type, (6) convert the bands to a torch tensor using the from_numpy() method (I must also remove a dimension with squeeze() and convert the data to a float type), and (6) convert the labels to a torch tensor and change the data type to a long integer. This method returns the bands and label tensors.
Again, the __len__() method must return the number of samples.
class EuroSat(Dataset):

    def __init__(self, df, bndMns, bndSDs):
        super().__init__
        self.df = df
        self.bndMns = bndMns
        self.bndSDs = bndSDs

    def __getitem__(self, idx):
        bands = [self.df.iloc[idx, 3:]]
        label = [self.df.iloc[idx, 2]]
        bands = np.array(bands)
        bands = (bands-self.bndMns)/self.bndSDs
        label = np.array(label)
        bands = bands.astype('float32')
        bands = torch.from_numpy(bands).squeeze().float()
        label = torch.from_numpy(label).squeeze().float()
        label = label.long()
        return bands, label

    def __len__(self):
        return len(self.df)
Next, I instantiate an instance of the EuroSat Dataset subclass called trainDS. This requires three inputs: the DataFrame of aggregated band means and class codes and the aggregated channel means and standard deviations. The means and standard deviations are used to perform data normalization.
Next, I instantiate the DataLoader using the dataset object. I use a mini-batch size of 128. Since I am now only using the band means as opposed to the entire image, I should be able to use more samples per mini-batch.
trainDS = EuroSat(trainAgg, trainAggMns, trainAggSDs)trainDL = torch.utils.data.DataLoader(trainDS, batch_size=128, shuffle=True, sampler=None,
num_workers=0, pin_memory=False, drop_last=False)Once you have instantiated the DataLoader, it is generally a good idea to explore it to make sure that the results are as expected. To do so, I generate an example mini-batch of data using the next() and iter() functions. I then unpack the resulting object to obtain separate bands and labels objects.
The shape of the bands object is (128, 10). This makes sense since the batch size is 128 and the number of channels is 10. The labels have a shape of (128), which makes sense since there is one label for each of the 128 samples in the batch. The data type for the bands is 32-bit float while the data type for the labels is long integer. Generally, PyTorch will expect 32-bit float values for the predictor variables. The required data type for the labels will vary by problem type. For a multiclass classification, a long integer data type is generally expected.
Extracting out a single image from the batch, you can see that the bands object consists of a 1D array of band means that have been normalized while the label is a single value.
So, it looks like the DataLoader is providing data by mini-batch in the expected format. We will make use of this DataLoader in the next module when we train a fully connected neural network.
batch = next(iter(trainDL))
bands, labels = batch
print(f'Batch Image Shape: {bands.shape}, Batch Label Shape: {labels.shape}')
Batch Image Shape: torch.Size([128, 10]), Batch Label Shape: torch.Size([128])print(f'Batch Image Data Type: {bands.dtype}, Batch Label Data Type: {labels.dtype}')Batch Image Data Type: torch.float32, Batch Label Data Type: torch.int64testBands = bands[1]
testLabel = labels[1]
print(testBands)tensor([-0.9489, -1.1123, -1.0219, -0.9841, 0.0078, 0.3767, 0.3528, -0.5182,
-0.8571, 0.5180])print(testLabel)tensor(1)5.7 DataSet and DataLoader for Image Data
In this last section, we will generate another DataSet and DataLoader. This is the DataLoader that we will use in the CNN examples in later modules. However, I will make some modifications to allow for transformations to be applied. In comparison to the above example, this DataLoader will return images and labels as opposed to band means and labels.
We will now be returning back to using the DataFrame in which each row represents an image and contains the file name, file path, class name, and class numeric code. We will also make use of the pixel-level band means and standard deviations calculated above to perform normalization.
Our new DataSet subclass will accept a DataFrame and pixel-level band means and standard deviations in order to perform normalization. These are defined inside of the __init__() constructor method. Inside of the __getitem__() method, I (1) extract the file path from the DataFrame, (2) extract the numeric label from the DataFrame, (3) read the image chip as a NumPy array using Rasterio (again, remember to close the connection to the file once it is read), (4) subset out the required bands, (5) perform normalization using the provided pixel-level band means and standard deviations, (6) convert the image to a 32-bit float data type, (7) convert the image and labels to tensors using the from_numpy() function, and (8) convert the label to a long integer data type. This function returns a processed image and associated label as tensors. Again, the __len__() method returns the number of samples.
class EuroSat(Dataset):

    def __init__(self, df, mnImg, sdImg):
        self.df = df
        self.mnImg = mnImg
        self.sdImg = sdImg

    def __getitem__(self, idx):
        image_name = self.df.iloc[idx, 1]
        label = self.df.iloc[idx, 3]
        label = np.array(label)
        source = rio.open(image_name)
        image = source.read()
        source.close()
        image = image[[1,2,3,4,5,6,7,8,11,12], :, :]
        image = np.subtract(image, self.mnImg)
        image = np.divide(image, self.sdImg)
        image = image.astype('float32')
        image = torch.from_numpy(image)
        label = torch.from_numpy(label)
        label = label.long()
        return image, label

    def __len__(self):
        return len(self.df)
Before instantiating an instance of the EuroSat dataset, I must prepare the channel mean and standard deviation data. I first convert the data to list objects. These lists are then processed to create tensors of shape (10, 64, 64) in which each channel holds the mean or standard deviation for that channel (all values will be the same in each pixel within each channel). This is so that the shape of these tensors match that of the image to which they will be applied. Once these tensors are obtained, I can instantiate the DataSet.
bndMns = np.array(band_stats[0].tolist())
bndSDs = np.array(band_stats[1].tolist())
mnImg = np.repeat(bndMns[0], 64*64).reshape((64,64,1))
for b in range(1,len(bndMns)):
mnImg2 = np.repeat(bndMns[b], 64*64).reshape((64,64,1))
mnImg = np.dstack([mnImg, mnImg2])
mnImg = np.transpose(mnImg, (2,0,1))
sdImg = np.repeat(bndSDs[0], 64*64).reshape((64,64,1))
for b in range(1,len(bndSDs)):
sdImg2 = np.repeat(bndSDs[b], 64*64).reshape((64,64,1))
sdImg = np.dstack([sdImg, sdImg2])
sdImg = np.transpose(sdImg, (2,0,1))
print(mnImg.shape)(10, 64, 64)print(sdImg.shape)(10, 64, 64)trainDS = EuroSat(train, mnImg, sdImg)In the DataLoader, I have set the batch_size parameter back to 32 since I will now be loading in (10,64,64) image chips as opposed to the pixel-level band means.
trainDL = torch.utils.data.DataLoader(trainDS, batch_size=32, shuffle=True,
num_workers=0, pin_memory=False, drop_last=True)
Again, it is good to check data mini-batches to make sure there are no issues. The shape of my mini-batches is as expected (32,10,64,64). The label batch consists of 32 single values. The data types for the image values is 32-bit float while the labels are long integers. The pixel values appear to be normalized.
Looking at a single image, you can see that the shape is (10,64,64) while the label is a single value. The range of codes seem correct and the pixel values appear to be normalized.
batch = next(iter(trainDL))
images, labels = batch
print(f'Batch Image Shape: {images.shape}, Batch Label Shape: {labels.shape}')
Batch Image Shape: torch.Size([32, 10, 64, 64]), Batch Label Shape: torch.Size([32])print(f'Batch Image Data Type: {images.dtype}, Batch Label Data Type: {labels.dtype}')Batch Image Data Type: torch.float32, Batch Label Data Type: torch.int64print(f'Batch Image Band Means: {torch.mean(images, dim=(0,2,3))}')Batch Image Band Means: tensor([ 0.1406, 0.1114, 0.0754, 0.0183, -0.1273, -0.1493, -0.1451, -0.0484,
0.0157, -0.1630])print(f'Batch Label Minimum: {torch.min(labels, dim=0)}, Batch Label Maximum: {torch.max(labels, dim=0)}')Batch Label Minimum: torch.return_types.min(
values=tensor(0),
indices=tensor(15)), Batch Label Maximum: torch.return_types.max(
values=tensor(9),
indices=tensor(3))testImg = images[1]
testMsk = labels[1]
print(f'Image Shape: {testImg.shape}, Label Shape: {testMsk.shape}')Image Shape: torch.Size([10, 64, 64]), Label Shape: torch.Size([])print(f'Image Data Type: {testImg.dtype}, Label Data Type: {testMsk.dtype}')Image Data Type: torch.float32, Label Data Type: torch.int64Since we now have image data as opposed to tables, it would make sense to actually visualize a batch of images and associated labels. This is accomplished using the code below. First, I create a function to display a single image. This requires (1) un-normalizing the image using the band means and standard deviations, (2) subsetting out the bands that will be displayed, (3) changing the dimension order to channels-last since this is expected by matplotlib, and (4) rescaling the data and converting them to an 8-bit unsigned data type.
I also define a dictionary to map the class codes back to the class names.
I then build the figure using matplotlib. This involves (1) initializing a plot with 32 subplots, (2) looping through the data to map an image to each subplot, and (3) assigning a title to each subplot that is the class label. The image is displayed using the imshow() method from matplotlib. I am using the red, green, and blue channels here, so the result will be a simulated true color composite.
If you are using a similar method to display image data and the images look too dark, too bright, or have too high or too low contrast, you may need to experiment with the scaling and normalization parameters.
def img_display(img, mnImg, sdImg):
    img = np.multiply(img, sdImg)
    img = np.add(img, mnImg)
    image_vis = img[[2,1,0],:,:]
    image_vis = image_vis.permute(1,2,0)
    image_vis = (image_vis.numpy()/6000)*255
    image_vis = image_vis.astype('uint8')
    return image_vis

dataiter = iter(trainDL)
images, labels = next(dataiter)
cover_types = {0: 'Ann Crop',
1: 'Forest',
2: 'Herb Veg',
3: 'Highway',
4: 'Industrial',
5: 'Pasture',
6: 'Perm Crop',
7: 'Residential',
8: 'River',
9: 'SeaLake'}
fig, axis = plt.subplots(4, 8, figsize=(15, 10))
for i, ax in enumerate(axis.flat):
with torch.no_grad():
image, label = images[i], labels[i]
ax.imshow(img_display(image, mnImg, sdImg))
ax.set(title = f"{cover_types[label.item()]}")
plt.show()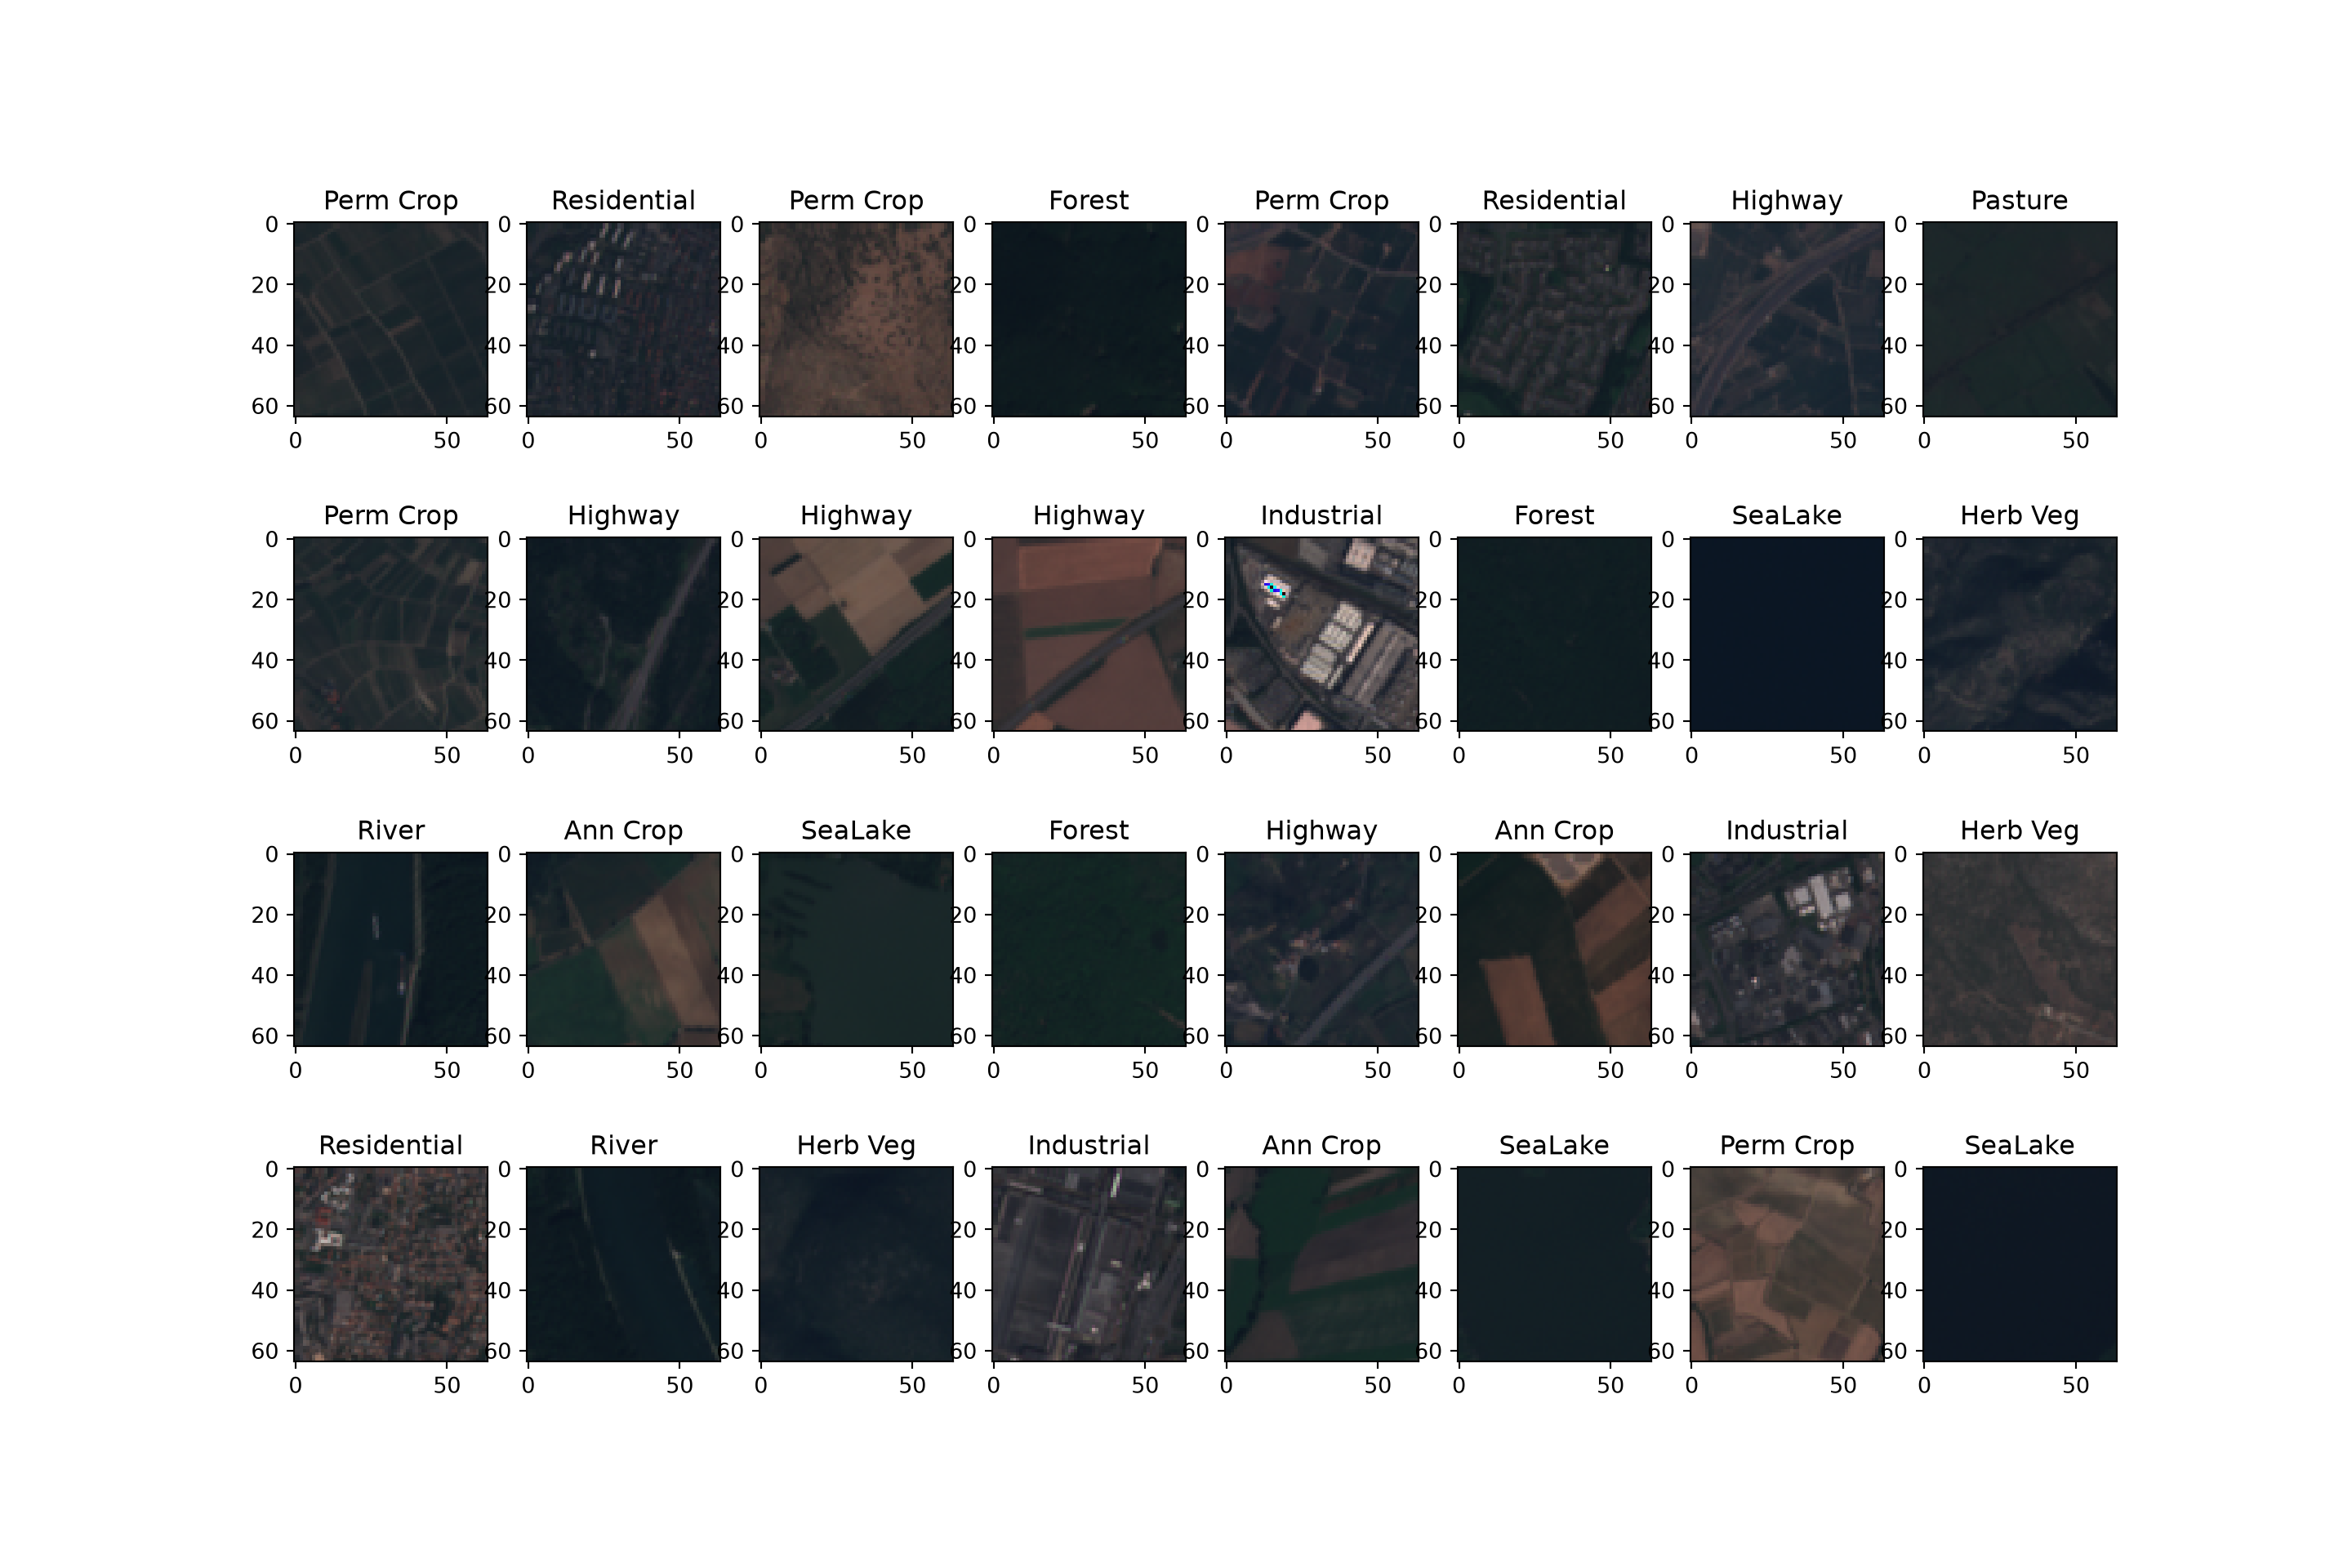
5.8 Data Augmentation with Albumentations
Deep learning models have a large number of trainable parameters, so they can easily memorize the training data as opposed to learning patterns that generalize to new data. One of the most effective means to reduce overfitting is data augmentation, in which random alterations are applied to each training sample every time it is loaded. Since the alterations are random and applied on the fly within the DataSet’s __getitem__() method, the model sees a slightly different version of each sample in each training epoch. This effectively increases the variability of the training data without collecting new samples. The goal is not to create unrealistic data, but rather to simulate the types of variability the model will encounter when applied to new data, such as differences in orientation, illumination, sensor noise, or atmospheric conditions.
Several packages provide augmentation tools. torchvision provides transforms, which we will use in Chapter 11. In this text, we primarily use the Albumentations package. Albumentations has several features that make it especially useful for geospatial applications:
- It operates on NumPy arrays, so it works with data read using Rasterio, OpenCV, or other packages.
- It applies the same geometric transformation to an image and its associated mask, bounding boxes, or keypoints. This is required for semantic segmentation, object detection, and instance segmentation since the labels must remain aligned with the image.
- Many of its transformations support images with more than three bands, which is common when working with multispectral imagery or stacks of terrain variables.
- It is fast and offers a large number of transformations.
Before we begin, note that Albumentations expects images to use the channels-last convention (height, width, channels), whereas Rasterio returns arrays using the channels-first convention and PyTorch expects channels-first tensors. So, the image must be transposed before the augmentations are applied and transposed back afterward (or converted with the ToTensorV2 transform, as demonstrated below). Masks are provided as two-dimensional arrays (height, width).
import albumentations as A
from albumentations.pytorch import ToTensorV2
5.8.1 Geometric Transformations
Geometric (or spatial) transformations change the positions of pixels, and they are applied to both the image and the mask. Common examples include flips, 90-degree rotations, arbitrary rotations, scaling, translation, and cropping.
For overhead imagery, flips and 90-degree rotations are generally safe and highly effective since overhead images do not have a “correct” orientation: a building or forest patch looks like a building or forest patch regardless of whether the image is rotated or flipped. Together, horizontal flips, vertical flips, and 90-degree rotations generate eight possible orientations of each chip (the dihedral group), and they do not require interpolating new pixel values. However, there are some important exceptions. For example, a hillshade is generated using a specific illumination direction, and flipping or rotating it changes the apparent direction of the light source, which can make ridges look like valleys. Similarly, some terrain variables, such as aspect, encode direction, so rotating or flipping the grid without also changing the values produces incorrect data. In these cases, you should either avoid these transformations or use orientation-independent inputs, such as a multidirectional hillshade or slope.
Arbitrary rotations and scaling require interpolating pixel values. Images are generally resampled with bilinear interpolation, while masks must use nearest neighbor interpolation so that class codes are not averaged into invalid values. Albumentations handles this automatically when the mask is passed using the mask argument. Arbitrary rotations also introduce empty areas at the corners of the chip, which must be filled. Scaling changes the apparent spatial resolution of the data, so it should be used cautiously when features are defined by their size or when the model will only ever be applied to data with a consistent cell size.
geomTransforms = A.Compose([
    A.HorizontalFlip(p=0.5),
    A.VerticalFlip(p=0.5),
    A.RandomRotate90(p=0.5),
    A.Affine(scale=(0.9, 1.1), rotate=(-15, 15), p=0.3),
])
5.8.2 Photometric Transformations
Photometric (or pixel-level) transformations change pixel values without moving them, so they are applied to the image only. Examples include changes to brightness and contrast, blurring, sharpening, and adding noise. These can simulate differences in illumination, atmospheric conditions, sensor calibration, or image quality between the training data and the data to which the model will be applied.
Photometric transformations require more care with multispectral data than with standard photographs. The relationships between bands, such as the high near infrared and low red reflectance of vegetation, carry much of the information used to differentiate classes. Aggressive or band-specific changes can disrupt these relationships and produce spectrally unrealistic samples. Many transformations designed for photographs, such as hue and saturation changes, assume a three-band RGB image and are not appropriate for other band combinations. I generally recommend using modest brightness and contrast changes, blurring, and noise, and making sure that the transformations are applied consistently across bands.
photoTransforms = A.Compose([
    A.RandomBrightnessContrast(brightness_limit=0.2, contrast_limit=0.2, p=0.5),
    A.GaussianBlur(blur_limit=(3, 5), p=0.2),
    A.GaussNoise(std_range=(0.01, 0.05), p=0.2),
])
5.8.3 Regularization-Style Transformations
Some transformations are designed specifically to make the model more robust as opposed to simulating realistic variability. Coarse dropout (also called cutout) removes random rectangular regions of the image, forcing the model to use the entire context of the chip as opposed to relying on a small number of highly distinctive features. Random resized cropping extracts a random portion of the chip and resizes it to the original dimensions.
regTransforms = A.Compose([
    A.CoarseDropout(num_holes_range=(1, 6), hole_height_range=(4, 12),
                    hole_width_range=(4, 12), p=0.3),
])
5.8.4 Building a Pipeline
Transformations are combined into a pipeline using A.Compose(). Each transformation has a probability, p, of being applied each time a sample is loaded. A.OneOf() can be used to randomly select only one transformation from a set, which is useful for avoiding stacking too many alterations onto a single sample. Normalization can be included as the last step using A.Normalize(), and ToTensorV2() converts the result from a channels-last NumPy array to a channels-first PyTorch tensor. Below, I define separate pipelines for the training and validation data. Augmentations should only be applied to the training data. The validation and testing data should only receive the deterministic preparation steps, such as normalization, so that model assessment is consistent and not affected by random alterations.
The band means and standard deviations are passed as lists, and max_pixel_value is set to 1.0 since I normalize data that have not been rescaled to an 8-bit range. If your data are 8-bit, max_pixel_value should be 255.
bandMeans = [0.5] * 10  # Replace with band means calculated from the training data
bandSDs = [0.5] * 10    # Replace with band standard deviations

trainTransform = A.Compose([
    A.HorizontalFlip(p=0.5),
    A.VerticalFlip(p=0.5),
    A.RandomRotate90(p=0.5),
    A.OneOf([
        A.GaussianBlur(blur_limit=(3, 5)),
        A.GaussNoise(std_range=(0.01, 0.05)),
    ], p=0.3),
    A.RandomBrightnessContrast(brightness_limit=0.2, contrast_limit=0.2, p=0.5),
    A.Normalize(mean=bandMeans, std=bandSDs, max_pixel_value=1.0),
    ToTensorV2(),
])

valTransform = A.Compose([
    A.Normalize(mean=bandMeans, std=bandSDs, max_pixel_value=1.0),
    ToTensorV2(),
])
The DataSet subclass below shows how a transform pipeline is integrated into the data loading process for a semantic segmentation problem. The image is read with Rasterio and transposed to channels-last. The image and mask are passed to the transform together using the image and mask keywords, so the same geometric transformations are applied to both. The transformed image is returned as a channels-first tensor by ToTensorV2(), and the mask is converted to a long integer tensor. For a scene labeling problem, the only difference is that a single label is returned as opposed to a mask, and the label does not need to be passed to the transform since geometric transformations do not change it.
class SegDataset(Dataset):
    def __init__(self, df, transform=None):
        self.df = df
        self.transform = transform

    def __getitem__(self, idx):
        with rio.open(self.df.iloc[idx]["image"]) as src:
            image = src.read().astype("float32")        # (C, H, W)
        with rio.open(self.df.iloc[idx]["mask"]) as src:
            mask = src.read(1).astype("int64")          # (H, W)
        image = np.transpose(image, (1, 2, 0))           # (H, W, C) for Albumentations
        if self.transform is not None:
            out = self.transform(image=image, mask=mask)
            image, mask = out["image"], out["mask"]
        else:
            image = torch.from_numpy(np.transpose(image, (2, 0, 1)))
            mask = torch.from_numpy(mask)
        return image.float(), mask.long()

    def __len__(self):
        return len(self.df)
5.8.5 Visualizing Augmentations
It is always a good idea to visualize the augmented data to make sure the transformations are reasonable and that the images and masks remain aligned. The code below applies the training pipeline, without the normalization and tensor conversion steps, to the same image several times and displays the results. If the augmented samples no longer look like plausible examples of the data, the augmentations are probably too aggressive. Note that the visualization assumes that bands 3, 2, and 1 (indices 2, 1, 0) are the red, green, and blue bands, respectively.
vizTransform = A.Compose(trainTransform.transforms[:-2])  # drop Normalize and ToTensorV2

with rio.open(train["fullpath"][0]) as src:
    image = np.transpose(src.read().astype("float32"), (1, 2, 0))
with rio.open("PATH/TO/EXAMPLE/MASK.tif") as src:
    mask = src.read(1)

fig, axs = plt.subplots(2, 4, figsize=(12, 6))
for i in range(4):
    out = vizTransform(image=image, mask=mask)
    rgb = out["image"][:, :, [2, 1, 0]]
    rgb = np.clip((rgb - rgb.min()) / (rgb.max() - rgb.min()), 0, 1)
    axs[0, i].imshow(rgb)
    axs[1, i].imshow(out["mask"], interpolation="nearest")
    axs[0, i].axis("off")
    axs[1, i].axis("off")
plt.show()
5.8.6 Practical Guidelines
Selecting augmentations generally requires some experimentation. Here are some guidelines that I have found useful:
- Start with flips and 90-degree rotations, which are almost always beneficial for overhead imagery and do not require interpolation. Make sure they are appropriate for your inputs (e.g., not single-direction hillshades or aspect).
- Add photometric transformations if the data to which the model will be applied may differ in illumination, atmospheric conditions, or sensor characteristics from the training data. Keep them modest for multispectral data.
- Use more aggressive augmentation when the training set is small and overfitting is evident and less augmentation when the training set is large.
- Only augment the training data. Do not augment the validation or testing data.
- Check that masks are resampled with nearest neighbor interpolation and remain aligned with the images.
- Since augmentations are applied on the fly, they increase the time required to load each mini-batch. If data loading becomes a bottleneck, consider using multiple workers in the DataLoader (
num_workers), as discussed above.
5.9 Concluding Remarks
The primary purpose of this module was to serve as an introduction to preparing data and using the DataSet and DataLoader PyTorch classes. This component of PyTorch seems to update often, so you may need to consult the documentation to adjust code to match current workflows. Also, it is possible to load data without using the DataSet and DataLoader classes. If so, your methods would need to be able to generate tensors for each sample of the correct shape and data type and deliver the data to the training loop in mini-batches. However, I find that it is easiest to subclass or use the DataSet and DataLoader classes and advise against trying to build a pipeline from scratch unless you are experienced with PyTorch.
I did want to note a few tips associated with using DataSets and DataLoaders since I have found this to be one of the trickier components of the workflow.
- In this module I used Rasterio to read image data. I did this because the images were generated using geospatial data and are multispectral, or have more than three bands. When you just have three-band or grayscale data, you can load images using other packages, such as PIL or cv2. I generally prefer to use cv2 over PIL, but this is just personal preference.
- When loading images into NumPy arrays or tensors using different packages, they may not adhere to the same conventions. For example, some packages may use the channels-first convention while others use the channels-last convention. PyTorch expects the channels-first convention. Dimensions can be reordered using the NumPy
transpose()function or the PyTorchpermute()function. - PyTorch can be picky about data types. However, you can convert between data types pretty easily using NumPy or PyTorch, such as converting 32-bit float data to long integer or unsigned 8-bit data to 32-bit float. Error messages are generally helpful when troubleshooting data type issues.
- It is generally good practice to assess your data mini-batches to make sure the output is in the correct shape, the data types have been defined correctly, and the dimension ordering is correct.
- If working with images, it is good to plot the images and the associated labels.
- Normalization is a common pre-processing requirement. Calculating means and standard deviations are sometimes necessary to apply normalization. When using transfer learning, you may normalize using the means and standard deviations from the original dataset as opposed to the current dataset. These values can generally be looked up. For example, the ImageNet means and standard deviations are as follows: means = [0.485, 0.456, 0.406] and standard deviations = [0.229, 0.224, 0.225]. In order to normalize to a range of 0 to 1, it is common to use a mean of 0.5 and a standard deviation of 0.5.
- Be careful not to cause a data leak. For example, you should normalize data using a common mean and standard deviation, such as those for ImageNet, or a mean of 0.5 and a standard deviation of 0.5. Normalizing the testing and validation data using their own means and standard deviations may result in inconsistent distributions between the dataset or a data leak by allowing the algorithm information about the distribution of the withheld data.
- Data transformations may also be applied to either prepare the data (e.g., crop, resample, or normalize) or augment the data to combat overfitting. Augmentations can be applied using torchvision or the Albumentations package, as discussed in the Data Augmentation with Albumentations section above.
- You may need to experiment with mini-batch sizes to efficiently use your hardware while also not running out of RAM or VRAM.
- Using more than one GPU can greatly improve training time and allow for larger data mini-batches. We will discuss how to use multiple GPUs in a later module.
- I have generally found that loading images from a magnetic hard drive can be much slower than loading them from a solid-state drive. Thus, I recommend storing your data on a solid-state drive, at least while conducting training, validation, and inference.
- In this module, I focused on reading files from disk by listing their names, file paths, and associated labels in a Pandas DataFrame. I did this because I have found this method to be intuitive. However, there are other means to load data that do not require listing each sample in a DataFrame. Please consult the PyTorch and torchvision documentation for examples of other dataset generation and data loading methods.
Now that we have covered defining fully connected architectures, loss metrics, assessment metrics, optimizers, training loops, DataSets, and DataLoaders, we are ready to train and assess a model. In the next section, we will train and assess a fully connected neural network to predict or differentiate land cover classes using the band means calculated from the pixels within each image chip. We will also incorporate validation at the end of each training epoch and an assessment of the final model using the withheld testing dataset.
5.10 Questions
- Explain the purposes of the DataSet and DataLoader classes in PyTorch.
- What two methods must be defined when subclassing the DataSet class, and what must each method return?
- Explain the purpose of the following DataLoader arguments:
batch_size,shuffle,drop_last, andnum_workers. - Why were the band means and standard deviations used to normalize the data calculated from the training partition only? What is a data leak?
- Explain the difference between representing each EuroSAT image chip using band means and using the full image chip. What information is lost when the chips are aggregated to band means?
- A mini-batch of image data has a shape of (32, 10, 64, 64). Explain what each dimension represents. What shape and data type would be expected for the associated labels in a multiclass classification problem?
- Why is it important to check the shape, data type, and range of values of the tensors returned by a DataLoader, and to visualize image chips and their associated labels, before training a model?
- Explain the difference between geometric and photometric data augmentations. Which type must also be applied to the mask in a semantic segmentation problem, and why must masks be resampled using nearest neighbor interpolation?
5.11 Exercises
Exercise 5.1: DataSet and DataLoader for a CNN-Based Scene Labeling Task
Introduction
The goal of this exercise is to build a table of image chips and class labels, partition the data, build a DataSet subclass, check that it is working properly, and define DataLoaders for a CNN-based scene classification problem. You will use the data partitions, DataSet, and DataLoaders defined here in Exercise 10.1 and Exercise 11.1.
Deliverables
- A Quarto (.qmd) file containing all required code and answers to the questions and discussion prompts, and the HTML webpage rendered from it
Data
This exercise makes use of the PatternNet dataset, which is described in the following publication and can be downloaded from the PatternNet website:
Zhou, W., Newsam, S., Li, C., and Shao, Z., 2018. “PatternNet: A benchmark dataset for performance evaluation of remote sensing image retrieval.” ISPRS Journal of Photogrammetry and Remote Sensing, 145, pp. 197-209. https://doi.org/10.1016/j.isprsjprs.2018.01.004.
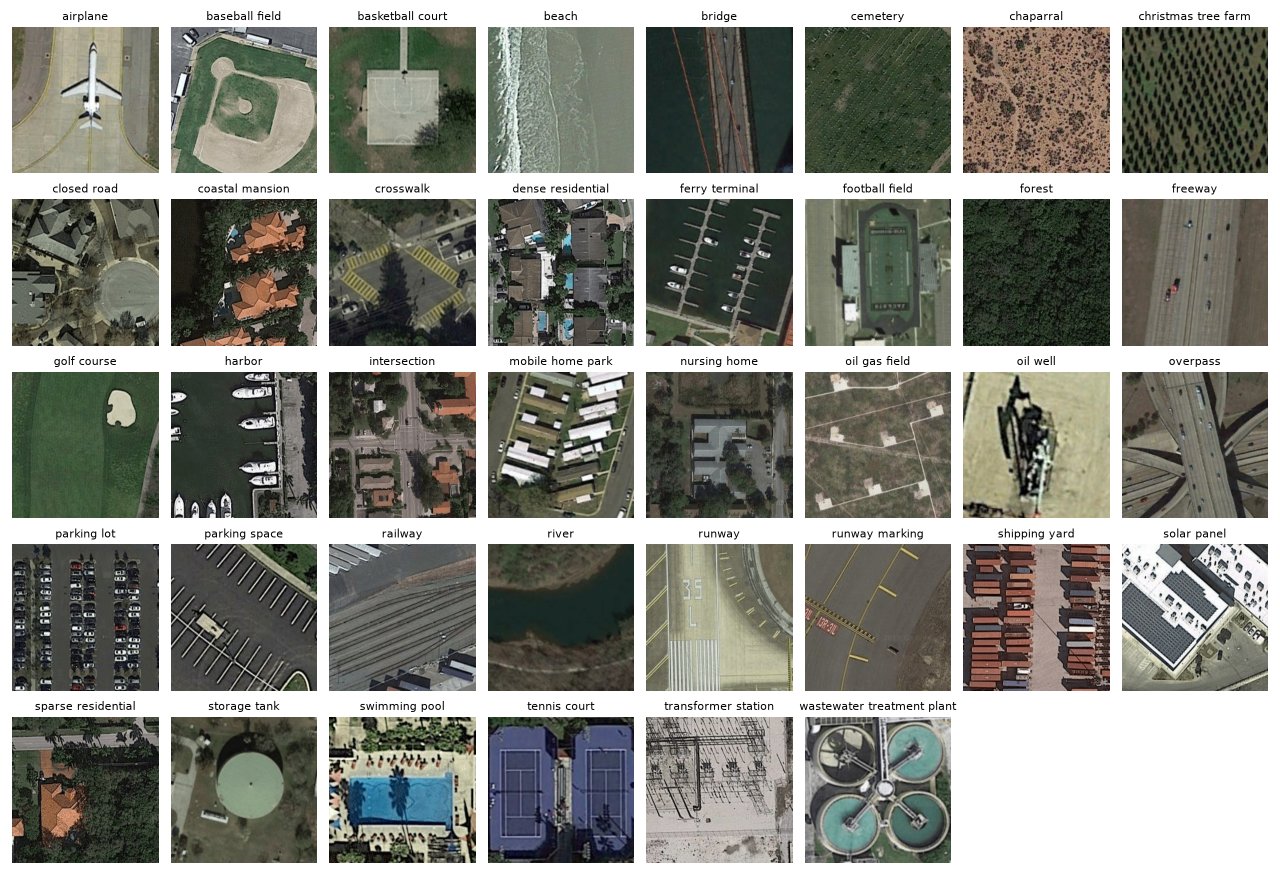
PatternNet was created to assess remote sensing image retrieval methods, but it is also well suited to scene classification. It consists of 38 classes, each represented by 800 images, for a total of 30,400 images. The images were collected from high spatial resolution imagery of cities in the United States, obtained through Google Earth and the Google Maps API. Each image has three bands (red, green, and blue) with 8-bit radiometric resolution (integer values from 0 to 255) and 256 rows and columns of pixels. The spatial resolution varies by class, from roughly 0.06 m to 4.7 m; the resolution for each class is listed in the patternnet_description.pdf file provided with the dataset. The images are provided as JPEG files and are not georeferenced. The following classes are represented: “airplane”, “baseball_field”, “basketball_court”, “beach”, “bridge”, “cemetery”, “chaparral”, “christmas_tree_farm”, “closed_road”, “coastal_mansion”, “crosswalk”, “dense_residential”, “ferry_terminal”, “football_field”, “forest”, “freeway”, “golf_course”, “harbor”, “intersection”, “mobile_home_park”, “nursing_home”, “oil_gas_field”, “oil_well”, “overpass”, “parking_lot”, “parking_space”, “railway”, “river”, “runway”, “runway_marking”, “shipping_yard”, “solar_panel”, “sparse_residential”, “storage_tank”, “swimming_pool”, “tennis_court”, “transformer_station”, and “wastewater_treatment_plant”.
We recommend saving the uncompressed PatternNet folder in the data/files folder (data/files/PatternNet) so that the images are stored in the data/files/PatternNet/images folder, which contains a sub-folder for each class named using the class name. Save any tables or models that you create to the data/output folder. Unlike the EuroSAT data used in the chapter, no table of images or predefined data partitions are provided, so you will create them. According to the dataset documentation, one image, closedroad361.jpg, is mislabeled: it does not contain a closed road.
Tasks
Task 1: Create a Pandas DataFrame that lists every image in the dataset, with one column containing the image’s file name and another containing its class, which is the name of the folder that contains it. Sort the table by class and then by file name, and remove the mislabeled closedroad361.jpg image. Report the number of images per class.
Task 2: Generate a new column in the table where each class is represented using a numeric code from 0 to 37, assigned in alphabetical order of the class names.
Task 3: Partition the data into separate training, validation, and test Pandas DataFrames using stratified random sampling by class: 70% of the images per class for training, 15% for validation, and 15% for testing. Use scikit-learn’s train_test_split() function twice (first to separate the training set and then to split the remaining images in half) with the stratify parameter and random_state=42 so that your partitions can be reproduced. Report the number of images in each partition and save each table to a CSV file for use in later exercises.
Task 4: Build a DataSet subclass that meets the following criteria:
- Accepts an input Pandas DataFrame and the path to the images folder.
- Returns an image as a PyTorch tensor with a shape of (3, 256, 256) and a 32-bit float data type and the numeric index representing the associated class as a long integer.
- Images should be read using Rasterio. Since the JPEG files are not georeferenced, Rasterio will issue a
NotGeoreferencedWarningfor each image; you can suppress it usingwarnings.filterwarnings("ignore", category=rio.errors.NotGeoreferencedWarning). - The images are 8-bit and scaled from 0 to 255. They should be rescaled from 0 to 1 by dividing by 255.
Task 5: Instantiate training, validation, and testing DataSets using your new subclass.
Task 6: Instantiate training, validation, and testing DataLoaders using your instantiated DataSets. Use a mini-batch size of 32, and shuffle the training data.
Task 7: Print summary information for a mini-batch of images. Confirm that the images have the correct shape/dimensionality, the correct data types (32-bit float for images and long integer for class indices), and the expected range of cell values and class indices. Plot the images in the mini-batch with their class names.